|
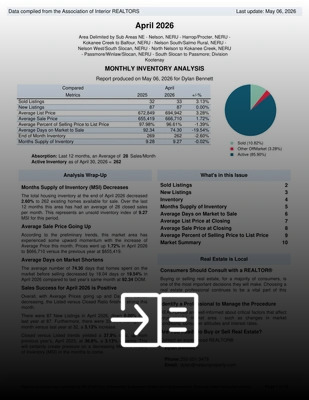
Hi from Bennett Family Real Estate. Now that May is wrapped up, we have had a chance to dig into the local numbers, and they are showing a really interesting shift. Both prices and total sales have cooled off a bit from this time last year. But here is the catch: the homes that are selling are actually moving faster than ever. It means that while there are lots of active buyers out there, they are focused on finding value, and sellers who price realistically from day one are finding success in record time.
Click Here for Full Market Report and Solds
Key Metrics Snapshot (May 2025 vs. 2026)
| Metric |
May 2026 Value |
Year-over-Year Change |
| Amount of Sold Listings |
31 |
-18.42% |
| New Listings |
104 |
-15.45% |
| Average List Price |
$636,820 |
-24.29% |
| Average Sold Price |
$628,701 |
-20.78% |
| % of List Price Achieved |
97.32% |
+1.48% |
| Average Days on Market (DOM) |
44.74 Days |
-12.00% |
| End of Month Inventory |
315 Homes |
-3.67% |
| Months of Supply (MSI) |
11.39 MSI |
-0.48% |
What the Data Reveals
Sales Volume and Pricing Shift: Closed sales dropped slightly from 38 to 31 year-over-year, which reflects a broader, market-wide softening as we head into the summer. Average sold prices fell 20.78% to $628,701.
While this is partionaly due to the overall pricing going down, it is also because a higher ratio of manufactured homes have sold that we have historically seen. We have been saying that for the last few months, and it might just be the new normal market for this area.
Swift Market Velocity: Despite a lighter closed volume, quality properties are moving rapidly. The average Days on Market dropped to just 44.74 days, down 12% from last year's 50.84 days. When sellers price in alignment with the current climate, buyers are acting with high intent, which is further validated by a strong Sold-to-List price ratio of 97.32% (up 1.48% year-over-year).
Stable Active Inventory: Total active inventory finished slightly lower at 315 existing homes, holding relatively stable compared to last spring's 327 units. With months of supply holding steady at 11.39 MSI, the market remains balanced, giving buyers time for due diligence while rewarding sellers who adopt realistic, expert-backed entry prices.
Your Local Real Estate Expert
Real Estate is local, and the numbers don't always tell the whole story. Let's discuss how these trends affect your unique Kootenay property goals. Chat with Bennett Family Real Estate Today
|
Phone: (250) 354-7471 | Email: info@nelsonproperty.com
|